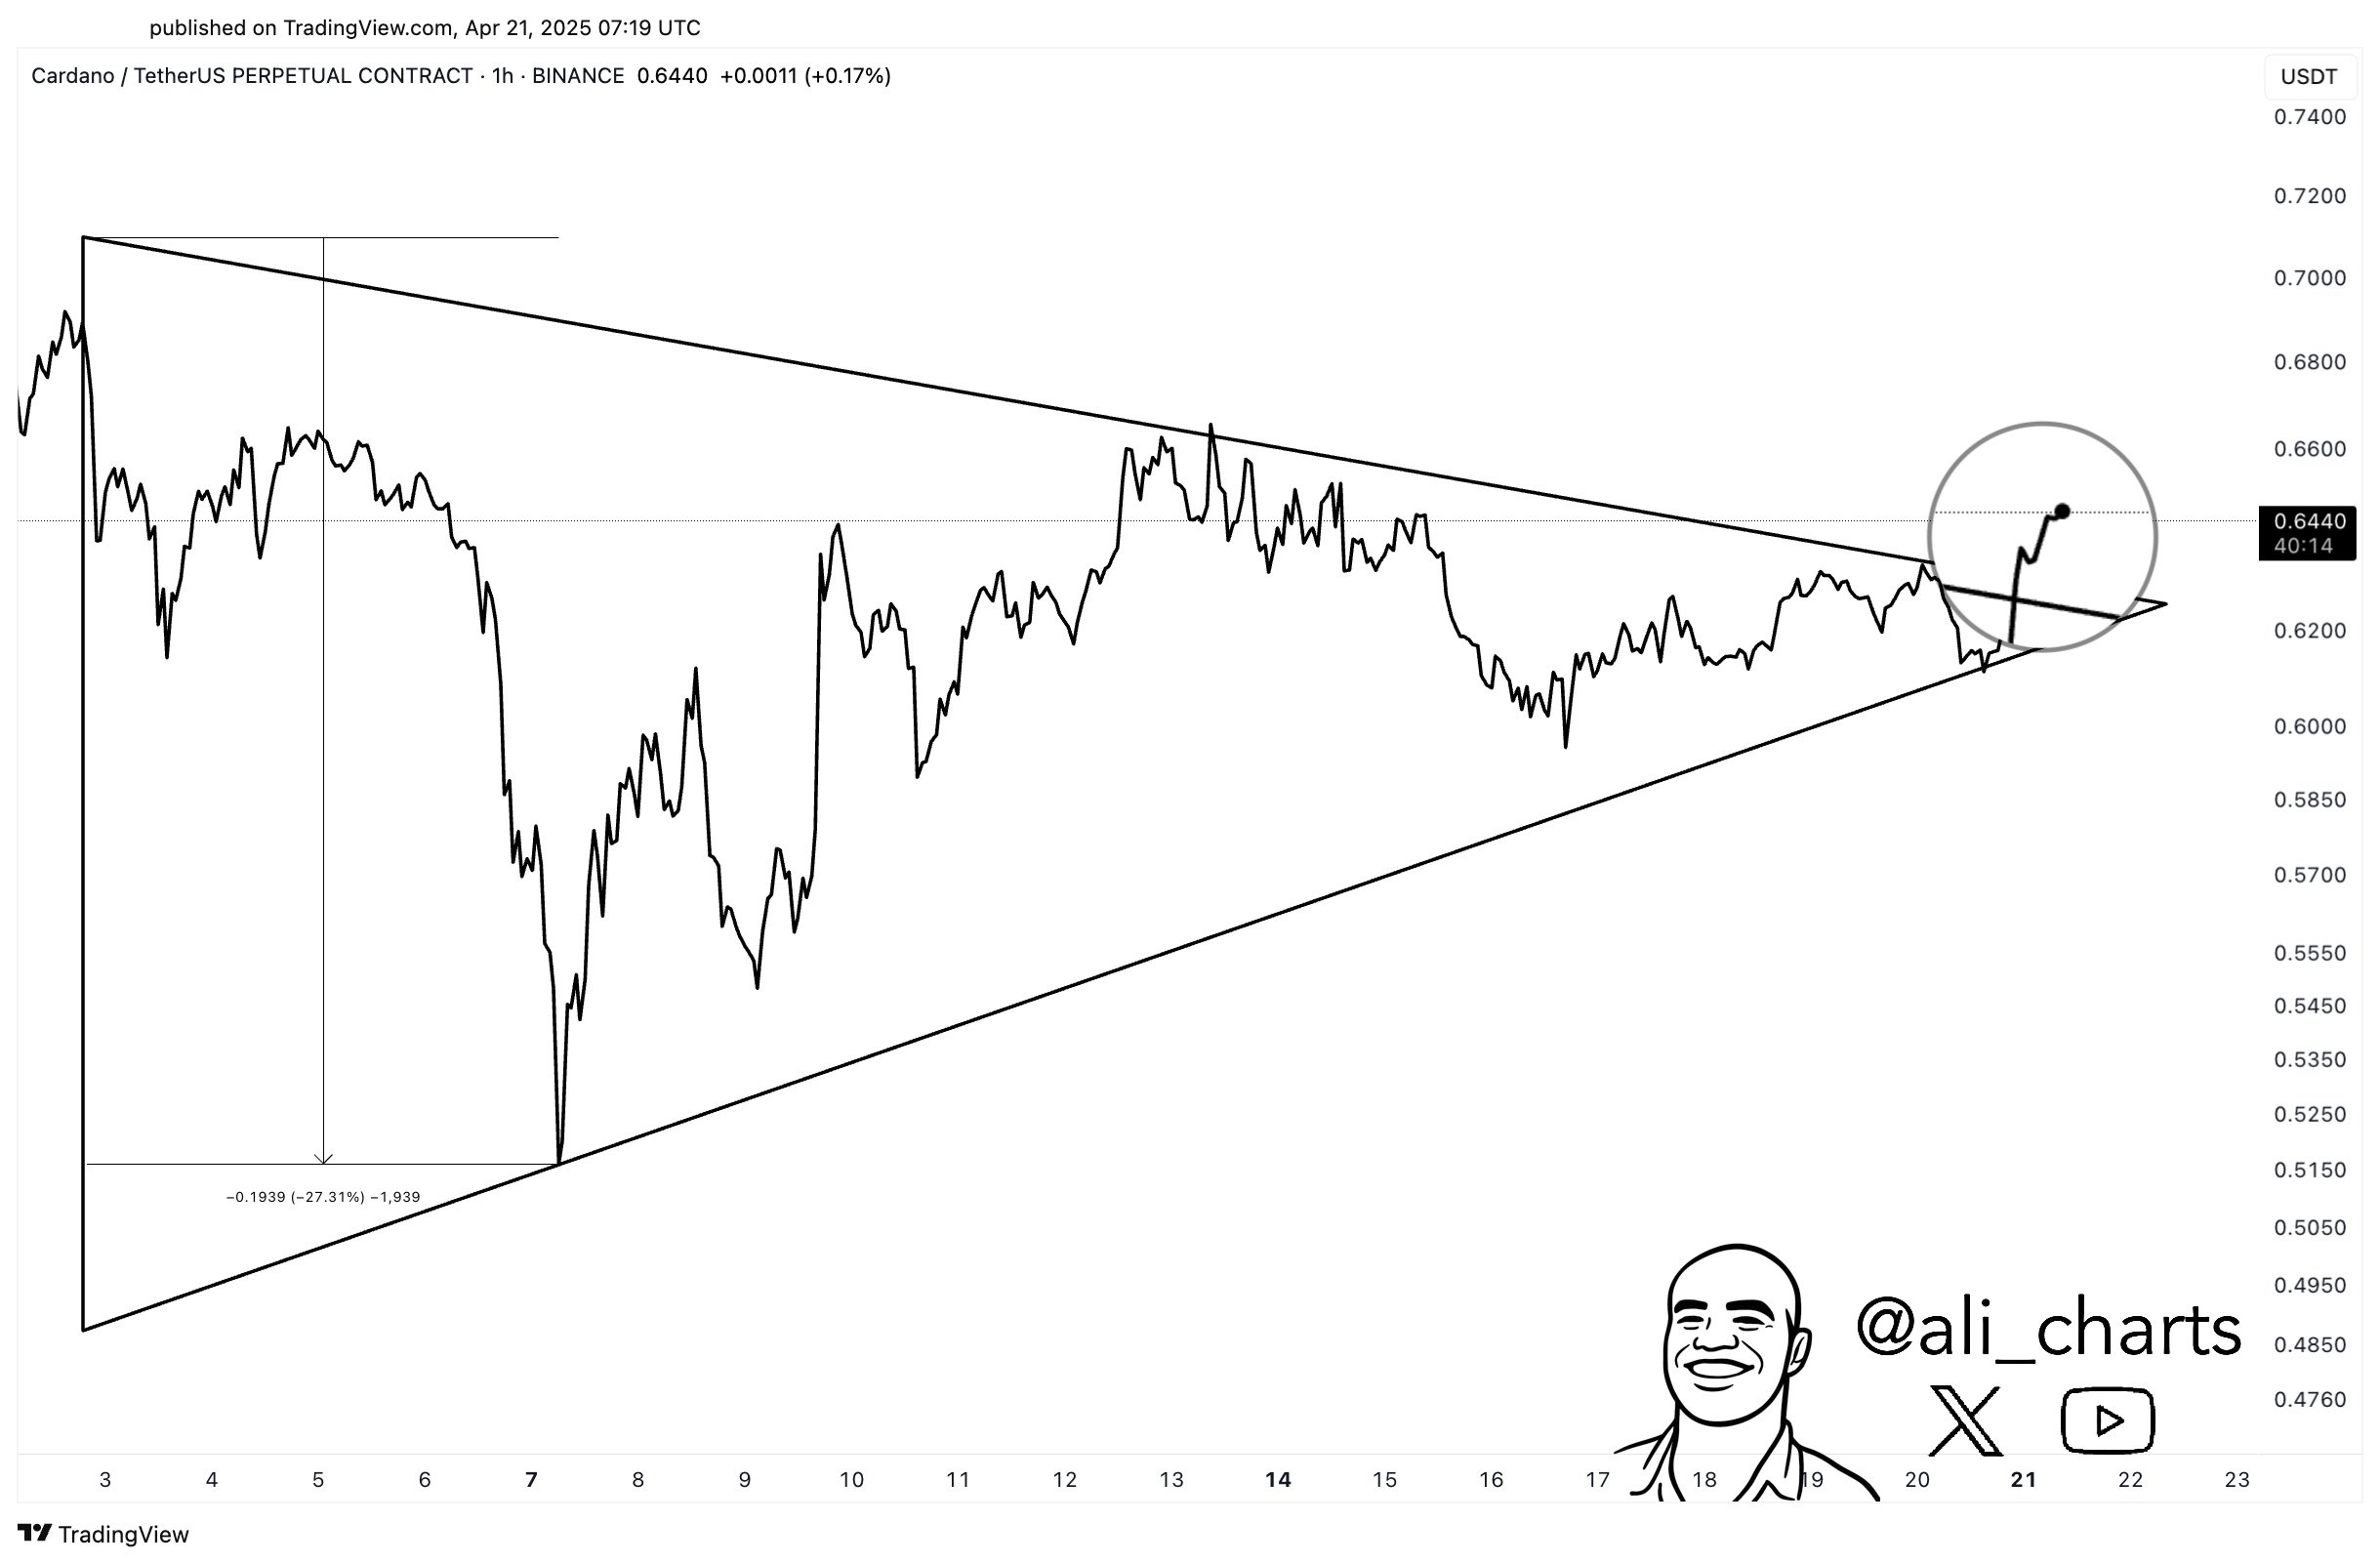
An analyst has pointed out how Cardano is currently breaking out of a Triangle pattern, a signal that could be bullish for ADA’s price.
Cardano Has Surged Beyond Triangle Resistance Line
In a new post on X, analyst Ali Martinez has talked about a technical analysis (TA) pattern forming in the hourly price of Cardano. The pattern in question is a Triangle, which forms when an asset consolidates between two converging trendlines.
The upper trendline is likely to act as a source of resistance in the future, while the lower one can provide support. Just like in many other TA consolidation patterns, a break beyond either of these lines can imply a continuation of the trend in that direction.
The trendlines being convergent means that as the price travels inside this type of consolidation channel, its range gets progressively narrower, until it compresses down to a point.
There are a few different types of Triangles in TA. The most popular variants include the Ascending, Descending, and Symmetrical Triangles. In the context of the current topic, the relevant Triangle is closest to the third of these. In this pattern, trendlines converge with each other at a roughly equal and opposite slope toward a midpoint.
Below is the chart shared by the analyst that shows the Triangle that Cardano was trading inside until the past day.
As is visible in the graph, Cardano had been moving inside this Triangle for almost three weeks, before a break arrived in the past day. Just prior to the break, the coin had nearly approached the apex of the triangle, meaning its consolidation had turned very tight.
Generally, as an asset’s range becomes narrower, a breakout becomes more likely. Yesterday, before ADA found its break, the analyst had shared the same chart for the Triangle, noting the stage was set for a move.
Martinez had noted that this move could potentially be a swing to equal to 27%, based on the height of the Triangle from the lowest price bottom. The question was which direction the breakout might occur in.
In Symmetrical Triangles, a breakout is equally likely in both directions. The Triangle that Cardano had been following wasn’t a perfect Symmetrical Triangle, though, as it had a slight ascending bias to it. This means that a break toward the upside may have been more probable, although only slightly.
This slight advantage in likelihood seems to have worked out for ADA this time, as its price has now witnessed a surge above the upper resistance line. It now remains to be seen whether this move would grow into a 27% one that the Triangle’s height hints at or not.
ADA Price
At the time of writing, Cardano is floating around $0.64, up more than 4% in the last seven days.


